자바스크립트] Canvas Line 그리기
- Javascript
- 2020. 3. 12.
아래 'graph' 버튼을 누르면 Canvas Line이 그려집니다.
Canvas의 크기는 width, height이며 좌표계는 원점에서 오른쪽 방향, 아래방향이 각각 x, y 양의 방향입니다.
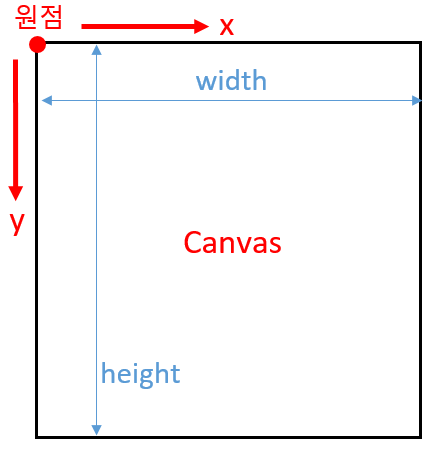
그려진 예의 Canvas 크기는 300x300로 잡았습니다.
<canvas id="canvas" height="300" width="300"></canvas>
Line색은 검정, 채우는 색은 회색(rgb 222,221,219), Line 두께는 7로 설정했습니다.
var ctx = document.getElementById("canvas").getContext("2d");
ctx.strokeStyle="black"; ctx.fillStyle = "rgb(222,221,219)"; ctx.lineWidth=7;
beginPath()로 Line의 시작을 명시 한 후 시작점, 연결될 점을 적어줍니다. moveTo(x,y)가 시작점이고 lineTo(x,y)가 두번째 점으로 선이 연결됩니다.두께(lineWidth)는 Line 중심에서 양측으로 절반씩 크기를 가집니다.
ctx.beginPath();
ctx.moveTo(50,25);
ctx.lineTo(250,25);
ctx.stroke();
두번째 그려진 Line을 보시면 꺽임점에서 자동으로 채워지면서 연결이 됩니다.

ctx.beginPath();
ctx.moveTo(50,85);
ctx.lineTo(250,85);
ctx.lineTo(250,40);
ctx.stroke();
세번째 Line은 시작점인 moveTo(x,y)를 마지막점 lineTo(x,y)로 만나도록 했는데 끝단처리가 이상합니다. ctx.beginPath();
ctx.moveTo(50,150);
ctx.lineTo(250,150);
ctx.lineTo(250,105);
ctx.lineTo(50,150);
ctx.stroke();

네번째 Line은 마지막점 lineTo를 없애고 closePath()하여 끝단도 자연스럽게 연결되도록 한 것입니다.
ctx.beginPath();
ctx.moveTo(50,215);
ctx.lineTo(250,215);
ctx.lineTo(250,170);
ctx.closePath();
ctx.stroke();

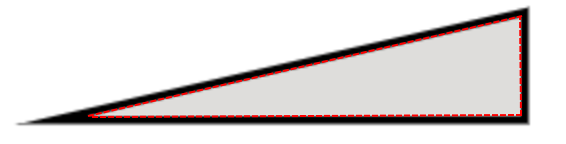
마지막은 fill() 명령을 통해 내부를 채웠습니다. Line중앙선을 따라 채워지므로 두께의 절반이 가려지게 됩니다.
ctx.beginPath();
ctx.moveTo(50,275);
ctx.lineTo(250,275);
ctx.lineTo(250,230);
ctx.closePath();
ctx.stroke();
ctx.fill();
|
<script language="javascript">
function draw(){
btn = document.getElementById('graph');
var ctx = document.getElementById("canvas").getContext("2d");
ctx.strokeStyle="black"; ctx.fillStyle = "rgb(222,221,219)"; ctx.lineWidth=7;
ctx.beginPath();
ctx.moveTo(50,25);
ctx.lineTo(250,25);
ctx.stroke();
ctx.beginPath();
ctx.moveTo(50,85);
ctx.lineTo(250,85);
ctx.lineTo(250,40);
ctx.stroke();
ctx.beginPath();
ctx.moveTo(50,150);
ctx.lineTo(250,150);
ctx.lineTo(250,105);
ctx.lineTo(50,150);
ctx.stroke();
ctx.beginPath();
ctx.moveTo(50,215);
ctx.lineTo(250,215);
ctx.lineTo(250,170);
ctx.closePath();
ctx.stroke();
ctx.beginPath();
ctx.moveTo(50,275);
ctx.lineTo(250,275);
ctx.lineTo(250,230);
ctx.closePath();
ctx.stroke();
ctx.fill();
}
function gclaer() {
resetbtn = document.getElementById('gclear');
canvas.getContext("2d").clearRect(0,0, canvas.width, canvas.height);
}
</script>
<form name="form">
<input id="graph" value="graph" onclick="draw()" type="button"/>
<style>
canvas {border:1px solid black;}
</style>
<body>
<canvas id="canvas" height="300" width="300"></canvas>
<input id="gclear" type="button" value="clear" onclick="gclaer()"/><br>
</body>
|
cs |
'Javascript' 카테고리의 다른 글
| 나이키 로고(Swoosh) 그리기 (5) | 2020.03.14 |
|---|---|
| 자바스크립트 선형대수(Linear Algebra) 행렬계산 (0) | 2020.03.13 |
| 자바스크립트 Chart.JS 바로 전 그래프 데이터 없애기 (0) | 2020.03.11 |
| 자바스크립트를 이용한 x,y 좌표그래프 그리기 [x,y graph drawing using javascript] (0) | 2020.03.11 |
| 로또번호 생성(자바스크립트) (8) | 2020.03.08 |